
The Posting Paradox: Why Posting Less Often Looked Like It Earned You More
I published a finding in May and spent the rest of the summer arguing with it.
The finding was that creators who post once or twice a week earn more per post than creators who post every day, and I need you to understand how much I wanted that to be true. It is a lovely result. It gives permission. It tells every tired professional churning out filler at eleven at night that the churn was the problem all along, and it lets me say something contrarian while being kind, which is the most flattering combination available to a person with a newsletter.
It went down extremely well. People wrote to me about it.
And it kept nagging at me, in the specific way a result nags when you like it more than you can justify. The nag had a shape, eventually, and the shape was a question I could not answer. Per post is not per week. If a heavy poster earns less per post but publishes six times, they can still finish the week miles ahead of the person who published twice. I had measured the per-post number and then quietly drawn a conclusion about the week, which is a different quantity that I had not measured at all.
Nobody made me go back and check. That is worth saying plainly, because the temptation to leave a popular result alone is enormous and it never announces itself as dishonesty. It arrives as being busy.
What the bands actually were
The original cut grouped every creator-week in the Index by how often that creator posted that week, then averaged engagement per post across the group. Light weeks came out at 2,863. The middle band came out at 1,209. The heaviest band came out at 1,366.
Read those three numbers again in order. They go down, and then they come back up.
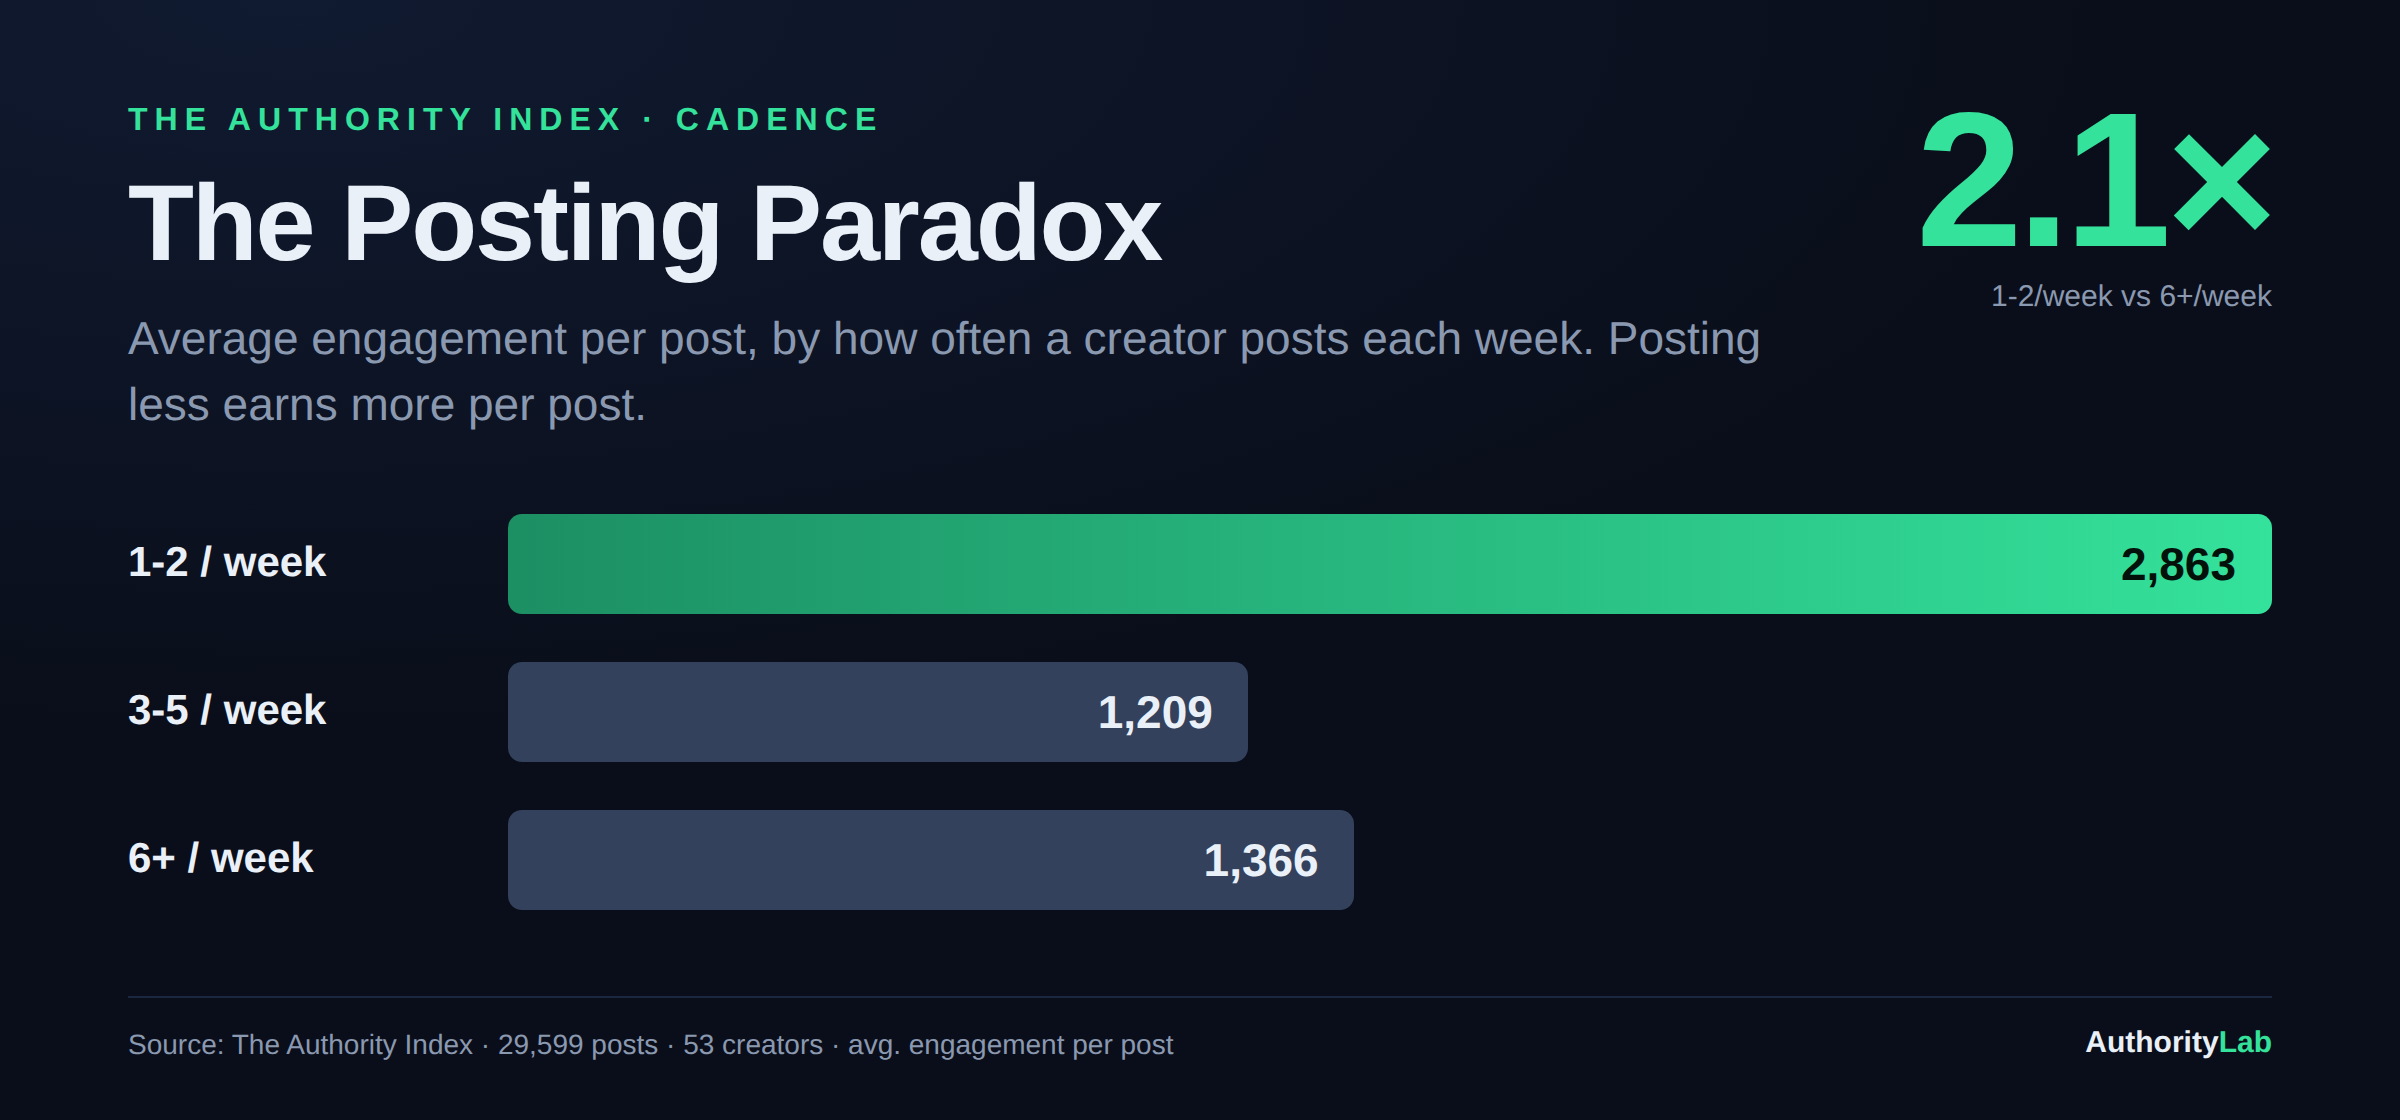
A real per-post penalty declines all the way down. A dip that recovers is the signature of something else entirely, and it was sitting on the face of the payload the whole time I was writing the article. I looked straight at it and saw a headline.
Here is what those groups were really made of. Posting frequency is close to a personality trait: people who post twice a week are, overwhelmingly, different people from the people who post daily, with different audiences, different jobs and different styles. So grouping by frequency very nearly sorts the corpus by author, and once you have sorted by author you are measuring authors.
How much does that matter? At one identical cadence, five posts a week, the Index holds one creator averaging thousands of engagements a post and another averaging a few dozen. A hundredfold spread, same frequency, so who lands in a bucket swamps anything the bucket is supposed to be measuring. Rebuild one of those bands by hand from its fifteen largest contributors and you reproduce its average almost exactly, purely from composition.
There was a second problem underneath the first. The light-week group reached back years further in time than the heavy-week group, so part of what I had published as a difference between habits was a difference between eras of the platform.
None of this makes the three numbers fake. They are what those groups did. They simply do not answer the question I put underneath them, and a correct number under the wrong question is the most convincing kind of wrong thing you can publish. It survives fact-checking. It survives a careful reader. It only falls over when somebody asks what the groups were made of, and for three months nobody did, including me.
The honest cut
The fix is not clever. It is just slower.
Compare every creator to themselves. Take each person's own lighter weeks and their own heavier weeks, anchor them to their own baseline, and never let two different humans sit on opposite sides of the same comparison. Nothing about audience size, luck, era or talent can leak in, because the same person is on both sides.
Run it that way and the paradox does not survive. In the broadest paired test available, all 52 measurable creators reached more people per week in their heavier weeks than in their lighter ones. Not most of them. All of them. And what remains of the original finding is much smaller and much more careful: in those same heavier weeks, 32 of the 52 earned less per individual post.
So both things happen at once. Each post lands a little softer, and the week lands considerably harder. Per-post efficiency turns out to be the wrong unit for a body of work, in the same way that words per hour is the wrong unit for a book.
The week is the unit. That is the sentence the May article should have ended on, and could not, because I had not run the measurement that produces it.
Why the correction runs here
The full replacement analysis, with the within-creator curve and the numbers behind it, is written up in What We Got Wrong About Posting Less. This page stays where it is, with its original address, because deleting a wrong article is a way of pretending you never published it.
The whole premise of this blog is that the measurement decides. The day that stops applying to my own conclusions, none of the rest of it is worth your time, and you should judge every finding I publish by what I do on the day one of them turns out to be wrong. The Index is versioned. The methods are described in How We Built the Index. When a better cut overturns a published claim, the correction runs under the same masthead the claim did.
What I do differently now
I judge the week, not the post. Weekly response is the number that tracks whether a presence is growing, and per-post averages are the vanity metric in this story, which is a strange sentence to write about a metric I built an article on.
I do not hold a good post back to protect an average any more. And before anything goes out with a number in it, I ask one question of the comparison: does the thing I am grouping by also predict who wrote the post? If it does, the comparison gets run inside each writer before it gets published, or it does not get published.
That rule cost me my favourite finding. It is the most valuable thing I own.
See where you stand. The 2-minute Authority Diagnostic benchmarks your content against all 29,599 posts in the Index and tells you which gap is costing you most.
Want it pulled apart with you? Book a 30-minute Authority Consult and we'll run your profile against the data, live.
Every figure here is one cut from the Authority Index: 29,599 classified LinkedIn posts from 53 creators.